|
Home » Audio » Pro Sound » Hornsub shootout
|
|
|
|
|
|
| Facilities and Photos [message #28069 is a reply to message #28056] |
Wed, 21 September 2005 16:17   |
 |
 Wayne Parham
Messages: 19002
Registered: January 2001
|
Illuminati (33rd Degree) |
|
|
Yesterday, I went to the race track to make final arrangements, check power, etc. While I was there, I clicked a few photos so all the exhibitors could get a feel for the place.
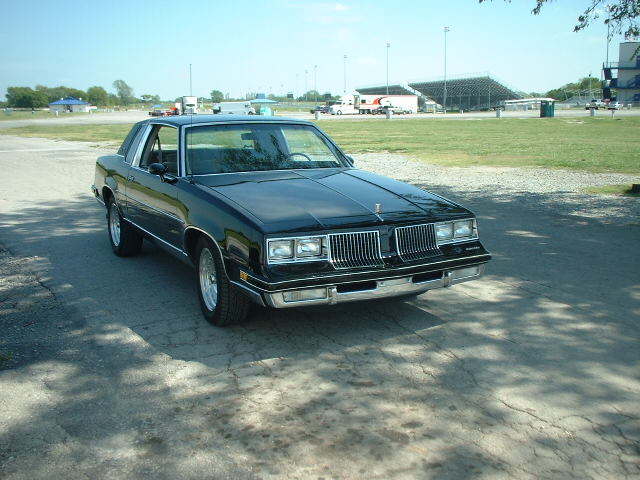 Tulsa Raceway Entrance
Notice the two semi trucks in the background behind my car. A Pro Gas racer had rented the track for a private tuning session. He was running 8 second quarter mile times, making that wonderful smell. 
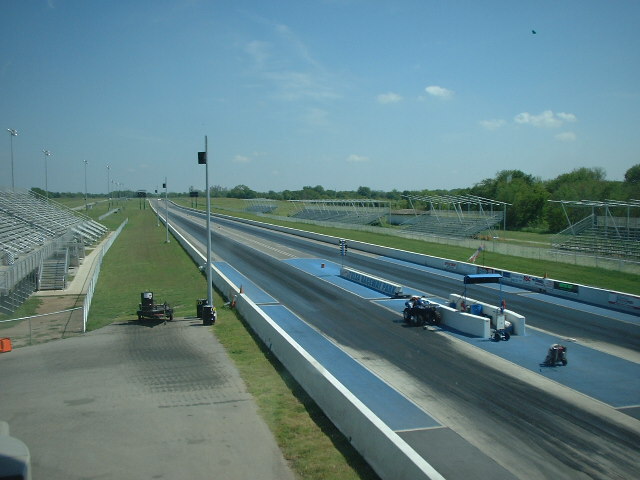 Staging area seen from inside the announcer's booth
The Tulsa track is nice, with a good launching pad and a perfectly straight and flat 1/4 mile run. If you look closely, you'll see the lanes begin a slight incline after the cars pass through the traps. That's because the fastest cars are going over 300 MPH at this point, and it helps 'em slow down. They go from zero to 300+ in less than 5 seconds in just a quarter mile, and then they have about 3/4 mile past that to get it shut down before hitting the sand trap. Most street cars turn off at the first or second exit, but the top fuelers need the whole road. The fastest cars these days are running the quarter mile in less than 4.5 seconds. That's quick! Most passenger cars don't cross an intersection from a stoplight that quickly.
We'll have the track all to ourselves until 6:00pm. After that, cars will begin to show up. So we will have a large quiet area for the day. Well, I don't know how quiet it will be, but I mean we won't have the rumble of race cars and dragsters during the day.
The complex is a mile ling and about a half mile wide. So we have plenty of space and no noise constraints. Here you can see an arial view of the entire track. The areas marked by the roads (white lines) mark a square mile. Tulsa is laid out on a grid with major roads every mile. There are North-South roads and East-West roads. The one shown on the left is Highway 169, which is parallel and very close to Garnett Road. The road at the bottom is Apache and the one at the right is 129 E. Ave. Just off the photo at the top is 36th Street North, which is the exit you take off Highway 169 to get to the track. You can see how the exit ramp takes you onto Garnett Road, which takes you to the track entrance. Each of these roads is a mile apart, forming a grid. Here's a map.
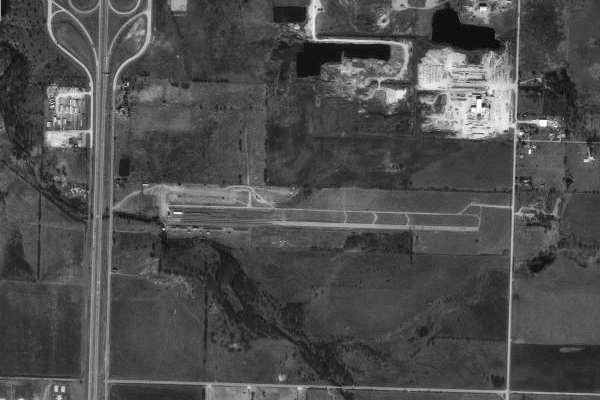 Tulsa raceway, arial view
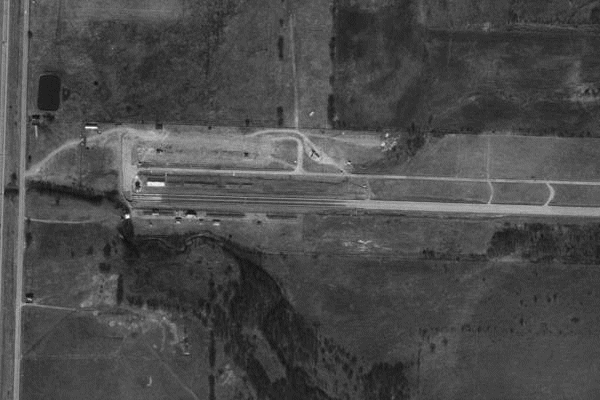 Tulsa raceway, zoomed to show about 1/2 mile across
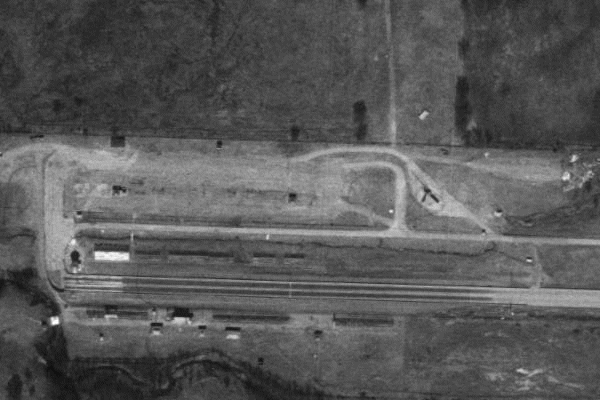 Tulsa raceway, zoomed to show about 1/4 mile across
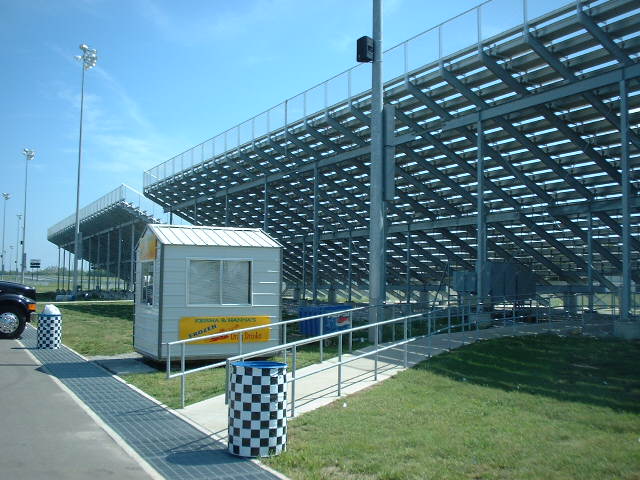 Spectator Seating, North Side
We will setup in the parking lot north of the track. The main power transformers and distribution area is under the spectator seats on the north side. All utilities are run underground, but we have access to them here.
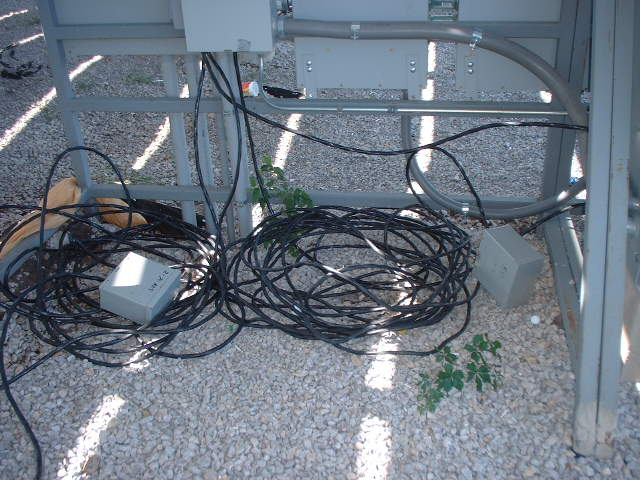 Power Distribution
Our main interconnect is a 70A line. There's a spool of wire to a utility box where we can connect. This will roll out to the parking lot and I'll terminate it with appropriate connectors prior to the Prosound Shootout. We'll have plenty of power, and I'll wire in a large connector for the main power amp and a barrier strip for the rest of the equipment.
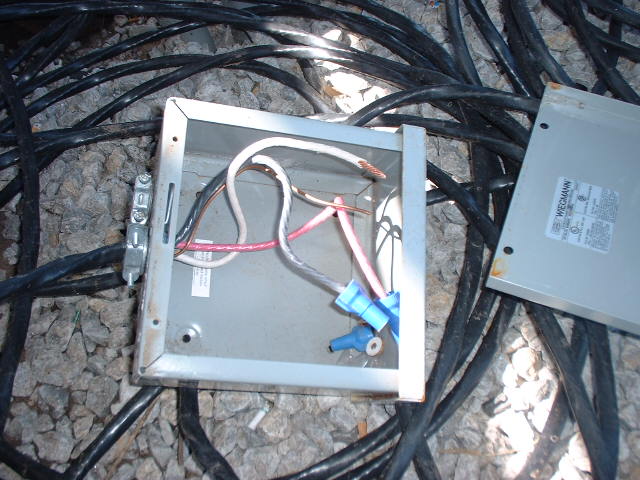 70A line
Here's a view from the transformers out to the parking lot. This is under the spectator seats. We'll spool our lines out into the parking lot from here.
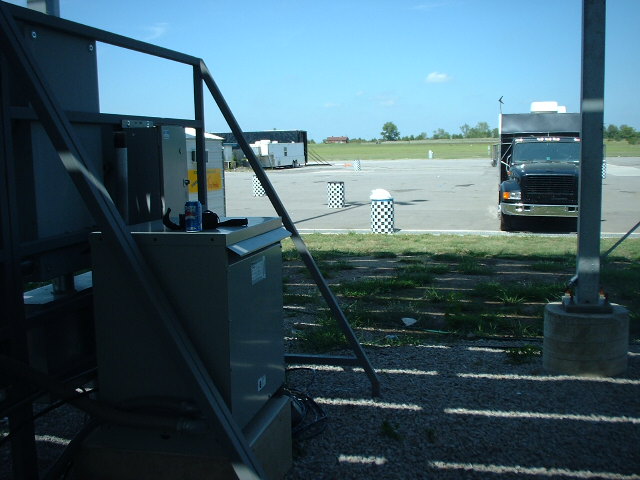 Under the spectator seats on the north side
Below you'll see a view of the parking lot, looking northeast, showing the restroom building. The field extends much further to the north, basically a large flat expanse.
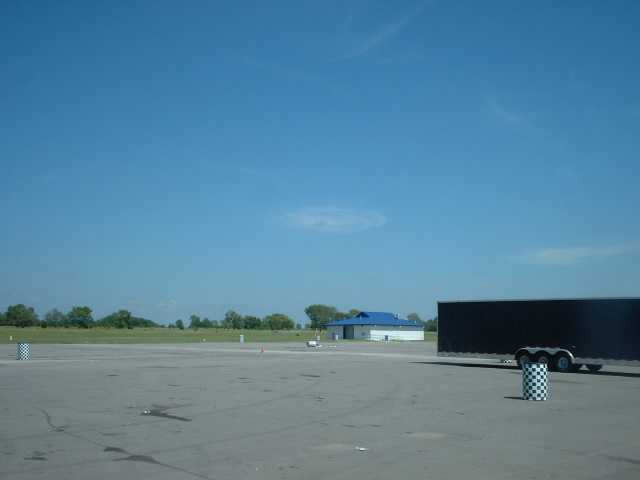 Pit area and north parking lot
This is a photograph of the same area, but taken from the announcers booth, three stories up. The camera is pointed northeast. You can get a better idea of the layout here, showing the pit area, concession stand, restroom and the land beyond. The semis are for the racer that was there that day.
Pit area parking lot seen from the announcer's booth[/align]
Nothing but land, looking straight north from the announcer's booth:
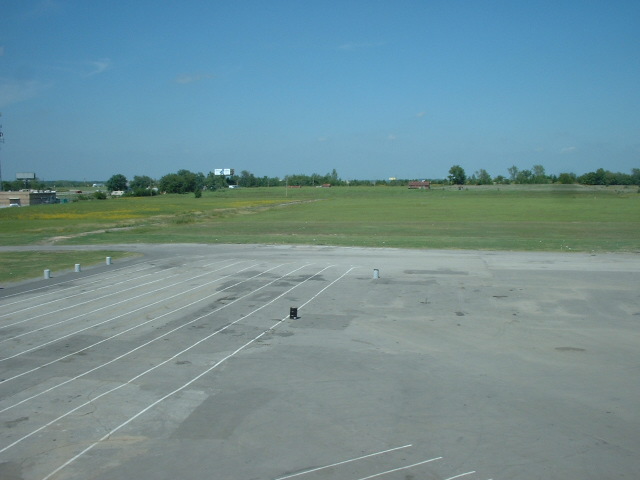 View straight north from the announcer's booth
Seen below is the view northwest from the announcer's booth. You can see the track entrance and the lanes where racers wait to be staged.
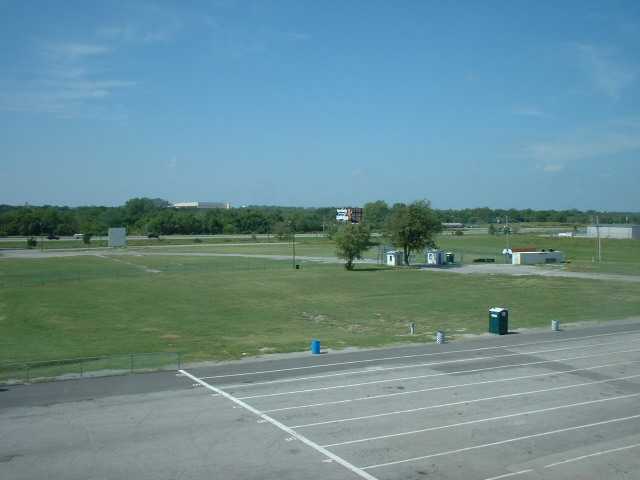 Track entrance
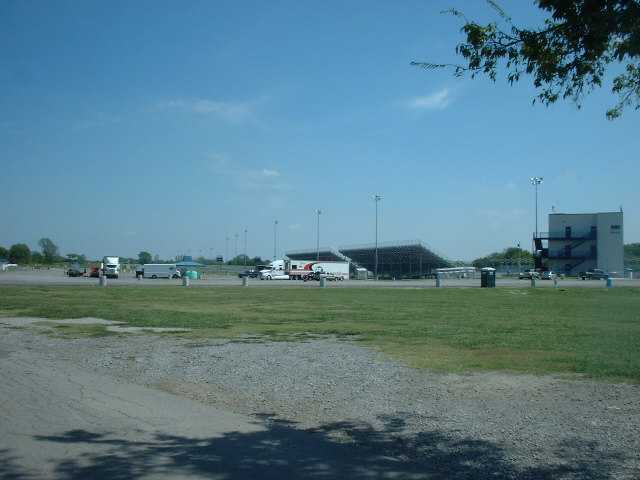 Ground level view of the track from the entrance
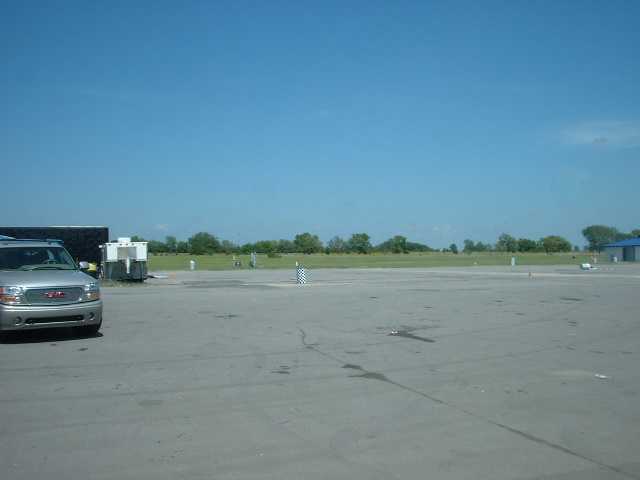 Ground level view of the pit area parking lot
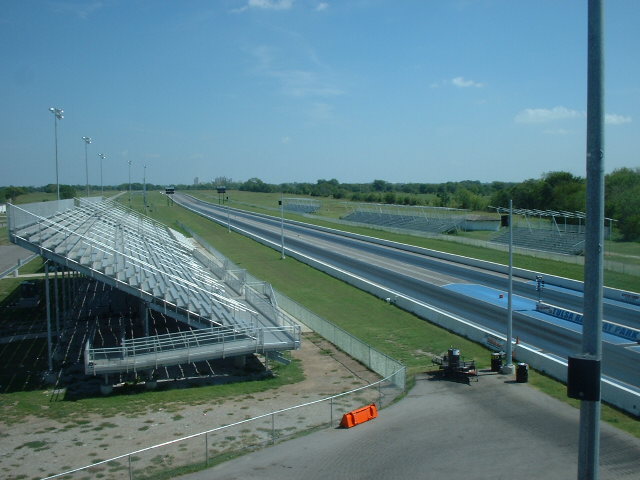 Track viewed from above the announcer's booth
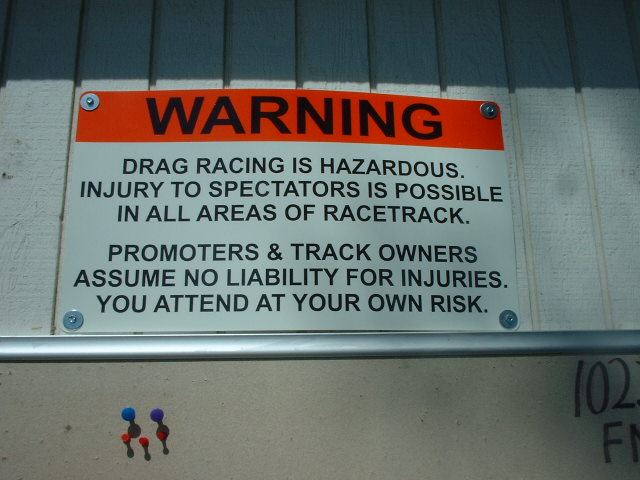
|
|
|
|
|
|
|
|
|
|
|
|
| Specific test plan [message #28077 is a reply to message #28058] |
Thu, 13 October 2005 17:56   |
 |
 Wayne Parham
Messages: 19002
Registered: January 2001
|
Illuminati (33rd Degree) |
|
|
The measurement system used is LMS 4.5 with the M51 calibrated precision microphone. Ground plane measurements will be performed, with the loudspeaker under test and the microphone placed on the ground. Both the loudspeaker and the microphone are placed 60 feet away from the nearest obstruction. The distance between loudspeaker and microphone is precisely measured for accurate SPL measurements, as described below.
1. Setup LMS presets for sweeps.
a. SPL: 10 - 1000Hz, 400 samples, both filters set as bandpass to track the sweep frequency (1.0) for maximum noise rejection. File - Save this Quickset preset as "SPL".
b. Distortion: 10 - 1000Hz, 400 samples, bandstop filter set to track the sweep frequency (1.0) to reject the fundamental, bandpass set to track harmonics (3.0). File - Save this preset as "Distortion".
Note: Distortion measurement can be done with bandpass set to isolate second harmonics by setting bandpass VCF tracking to 2.0. A second distortion measurement can be done to capture combined second and third harmonics by setting bandpass VCF tracking to 3.0. But the bandpass filter function is first-order, so there isn't much difference. For all practical purposes, the 3.0x setting can be considered a THD+N measurement. The bandstop filter rejects 40dB, so it does a pretty good job of eliminating the fundamental from the sweep. 40dB rejection sets the lower limit of our ability to measure distortion to 1%. We can tell when distortion rises above this, but cannot determine distortion levels below 1%.
2. Get noise floor baselines.
a. Connect microphone. Leave oscillator disconnected.
b. Run SPL sweep with amp disconnected and obtain SPL chart. Set Analyzer - Parameters - Data Curve. Choose an unused entry. Avoid accidentally recording over a previous dataset. Select Analyzer - Sweep to perform the measurement.
c. Run distortion sweep with amp disconnected and obtain SPL chart. Set Analyzer - Parameters - Data Curve. Choose an unused entry. Avoid accidentally recording over a previous dataset. Select Analyzer - Sweep to perform the measurement.
3. Measure impedance.
a. Connect oscillator output to loudspeaker. File - Load Quickset file "Zimp2wire." Remember to set Analyzer - Parameters - Data Curve and choose an unused entry to avoid accidentally recording over a previous dataset. Then click Analyzer - Sweep.
b. Determine impedance for the loudspeaker by examining the graph. This will determine power levels at various voltages.
V = √ PR<br>P = V2/R
Note: The same decibel value measured at 1W/1M will also be measured at 10 meters if power is increased by 100x or voltage increased by 10x. When finding 1W/1M values, scaling is useful for reducing horn path length error since most basshorns have path length greater than 2 meters. The SPL value measured at 10 meters is 20dB less than SPL at 1 meter. Our goal is to obtain measurements for values of 2.83V/1M and 1W/1M (using 28.28V/10M and 100W/10M), and then double power for each subsequent measurement, i.e. 200 watts, 400 watts, etc.
4. Measure amplitude response.
a. Connect oscillator output to amplifier. Click Analyzer - Osc On. Set voltage for value required.
b. File - Load Quickset file "SPL". Remember to set Analyzer - Parameters - Data Curve and choose an unused entry to avoid accidentally recording over a previous dataset. Then click Analyzer - Sweep.
5. Measure distortion.File - Load Quickset file "Distortion". Remember to set Analyzer - Parameters - Data Curve and choose an unused entry to avoid accidentally recording over a previous dataset. Then click Analyzer - Sweep.
Reminder: Distortion at 28.28v and 100 watts will be higher than at 2.83v and 1 watt levels.
6. Generate impulse response. Perform an inverse Fourier transform. Select "Processing - Inv Fast Fourier Transform". Choose the response curve generated in step 4 as the "Source Curve" and select two unused entries, one for impulse and the other for step. Label them accordingly and click "Execute".
Repeat steps 4 - 6 at 28.28v, 100 watts, 200 watts, 400 watts, etc.
7. Heat soak the speaker. Set "Analyzer - Parameters" Frequency to 40Hz. Then click "Osc On" or press F10. Set the voltage level to 80% maximum power and leave running for 15 minutes.
Repeat steps 4 - 6 at high power levels, comparing results with the measurements made at the same power levels prior to heat soaking the driver.
|
|
|
|
| Re: Hornsub shootout RESULTS [message #28078 is a reply to message #28056] |
Sat, 15 October 2005 11:02   |
 |
 Wayne Parham
Messages: 19002
Registered: January 2001
|
Illuminati (33rd Degree) |
|
|
We absolutely couldn't have picked a better day for the Prosound Shootout. The weather was clear, no wind, temperature about 65° when we arrived at the track, warmed to the low 80's in the afternoon. We all got some sun, that's for sure.
There were a couple of no-shows, and at first that kind of bummed me out. But after we got going, I realized that we would be pressed for time if everyone had showed. Even as it was, we had to leave out the heat soak part of the test. Those of you that run your equipment at high power levels longer than a couple hours know the results of heat soak, so it is an important metric to quantify. Speakers driven to high power levels have a life expectancy that's inversely proportional to both power and time. There is a sort of thermal de-rating that sets in over the duration of a high-power event. But measuring this and quantifying it takes time, and is probably better left to measure in another venue and not at an event like this.
The systems that were there were all winners. I was pretty amazed at the level of performance displayed. The Tuba 24 is tiny as hornsubs go, measuring only 8 cubic feet (2'x2'x2') and it packed a punch. Leland Crooks was able to pick it up easily, and yet it still had useable response down to 40Hz and sounded very powerful. The Bassmaxx horn was incredibly flat. From 70Hz to 140Hz, the amplitude response was perfectly flat. It was amazing, basshorns don't have that kind of response. A straight diagonal line (easily EQ'ed) up to 70Hz, and then perfectly flat out to the upper cutoff point. David Lee was understandably pleased, and Johan Van Zyl will be proud when he sees the data too. And my 12π basshorn performed very well, exceeding my expectations. A single 12π basshorn generated 118dB at 10 meters, which is equivalent to 138dB at 1 meter. From this, I would expect a pair of horns to provide 144dB and four horns should produce 150dB.
So I've realized that the systems all were winners, with the Bassmaxx providing the flattest response curve of a single basshorn, the 12π providing the most power and the Tuba 24 being the most portable, great sound in a small package.
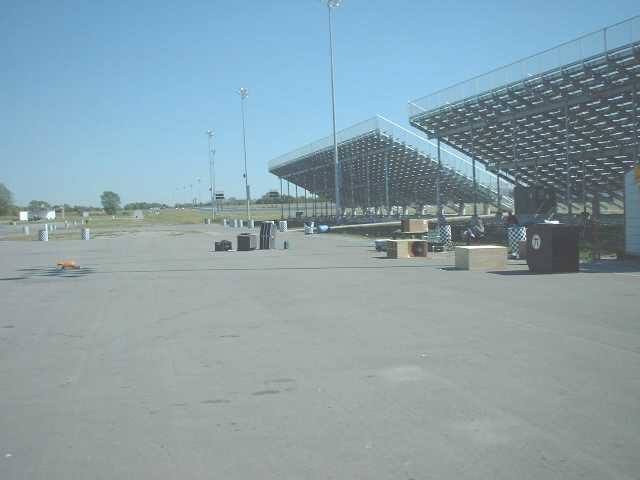 Prosound Shootout Test Setup
The speakers were pulled out 60 feet from the stands, and the test computer and amplifiers were a few feet away. The test microphone was run 10 meters out and sat on a pad directly on the ground.
We had written a detailed test plan, and we stuck to it. That made the measurements go just like clockwork. The first thing we did was to measure the ambient sound, to get a baseline. The graph shown below is the noise floor for all tests. When the response curve dips below this line, the data becomes ambiguous. This is particularly true of the distortion test. We did a noise floor measurement for both filter setups used to measure SPL and distortion, but they are both fairly close. So the chart below is the noise floor for all of the datasets measured at the Prosound Shootout.
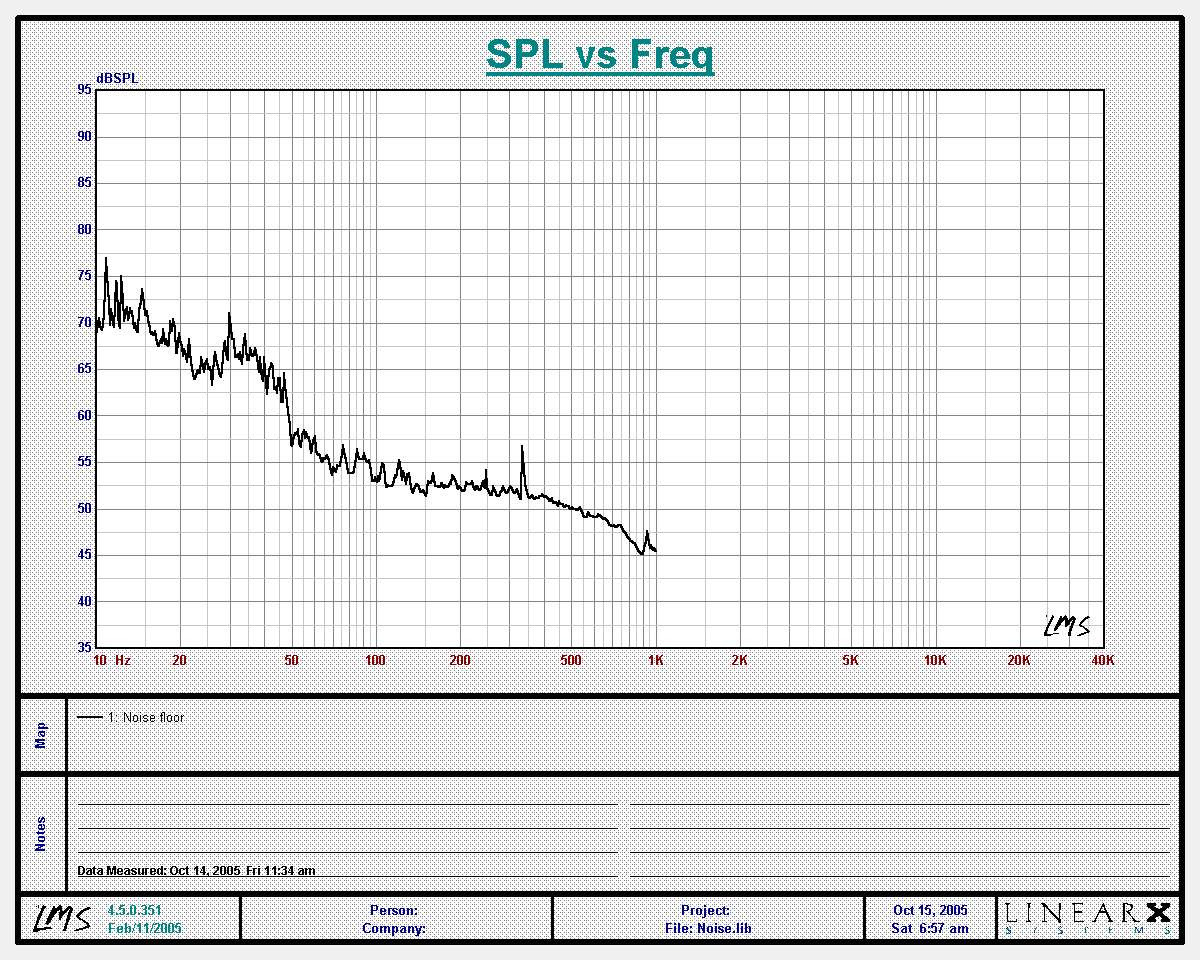 Noise Floor
The next thing we did was to measure impedance for the loudspeaker under test. Not only was this information recorded, but we also used it to determine voltage levels needed to drive the speaker to specific power levels. This was one place where data interpretation was somewhat flexible, since impedance is not constant through the passband.
As an example, look at the Bassmaxx impedance curve. All horn loudspeakers have peaks, some larger than others. But the point is, you don't have a uniform impedance, and you don't even really have a good average value. Impedance through most of the passband is relatively low, with a few large peaks. I'm not sure it makes sense to consider impedance to be greater, although the average value most certainly is. At any rate, we would all be using the same metric, so we simply had to agree upon one and David Lee suggested using Zmin, and we all agreed.
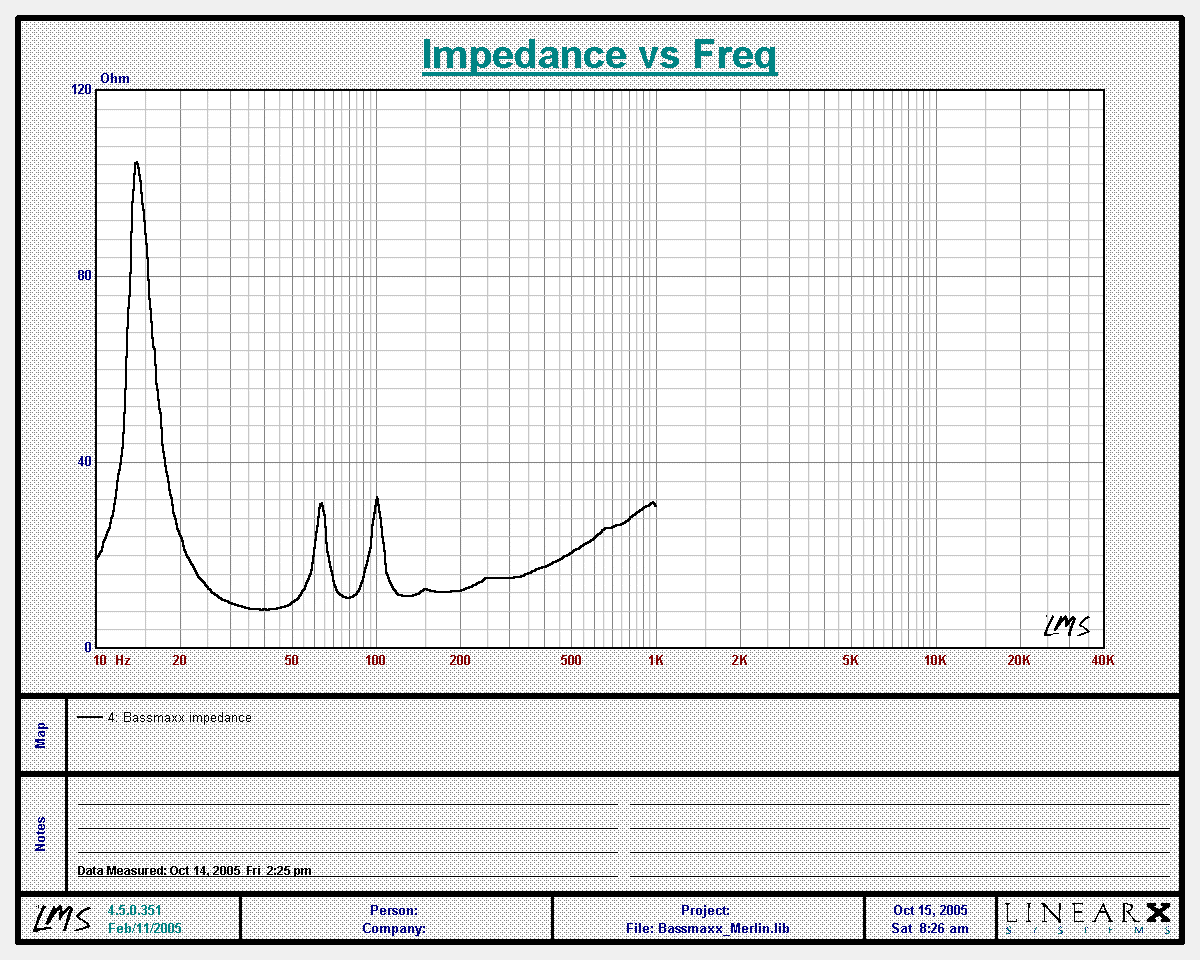 Bassmaxx Impedance Curve
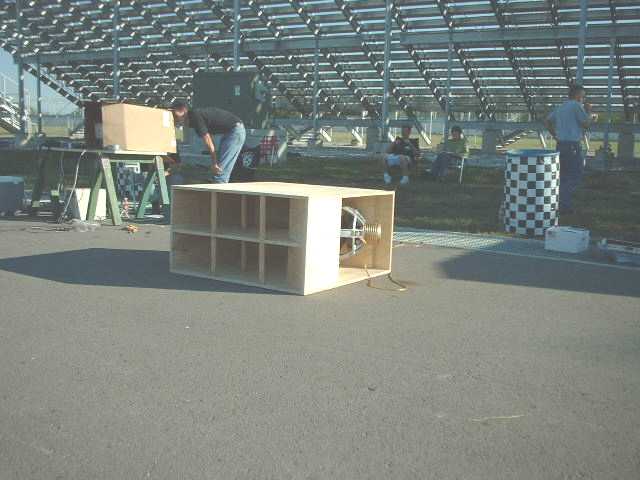 Bassmax Horn Subwoofer
In each case, we measured at 28.28v. This generates 100 watts for 8 ohm loads, a little more for lower impedance loads and a little less for higher impedance loads. But it was the one absolute voltage level that we picked for all loudspeakers to be tested with. Since we measured 10 meters away, the SPL value obtained also corresponds to 2.83v/1m.
Using the Zmin value obtained from the impedance chart, we calculated voltage levels required to drive the speaker to 100 watts, 200 watts, 400 watts, and so on. We performed SPL and distortion measurements at each of these levels for every speaker, up to whatever power level the owner was comfortable with. Since my 12π basshorn was a proof-of-concept prototype, I wanted to push it to the point of failure, and to determine whether its limits were due to mechanical or thermal failure. Others participants were more conservative.
|
|
|
|
Goto Forum:
Current Time: Tue Feb 17 03:09:59 CST 2026
|


