
Posted by Wayne Parham [ 70.234.99.36 ] on February 15, 2009 at 00:26:37:
In Reply to: Re: Art Array Improved Crossover posted by Wayne Parham on February 09, 2009 at 15:38:31:
Fred Thompson linked to a thread on another forum, where there has been discussion about his ART Array design and some proposed changes to it.
I spent some time making responses over on that thread, but found a little too much vitriol over there for my tastes. That's one of the reasons I rarely post in forums outside of ART. So I'll post here instead.
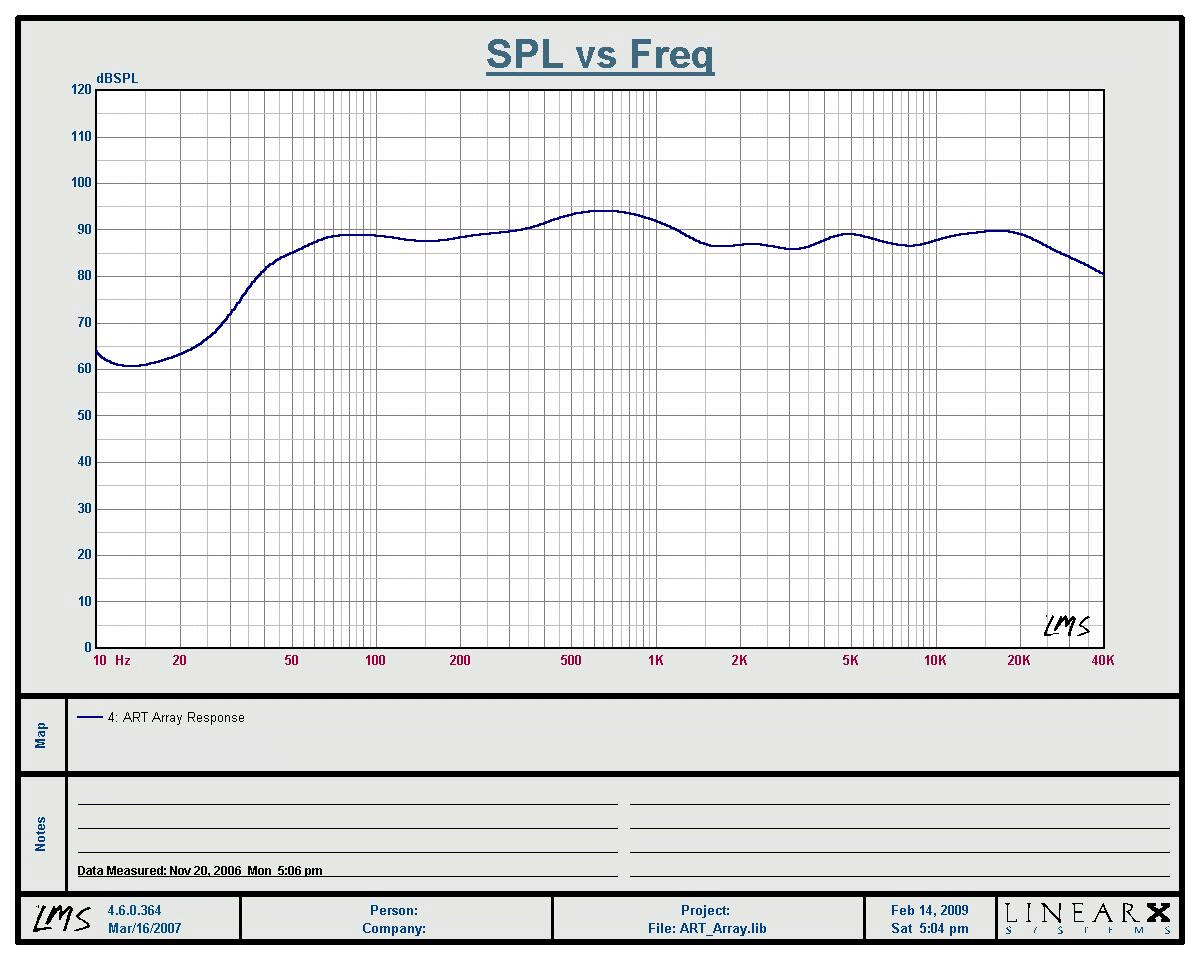
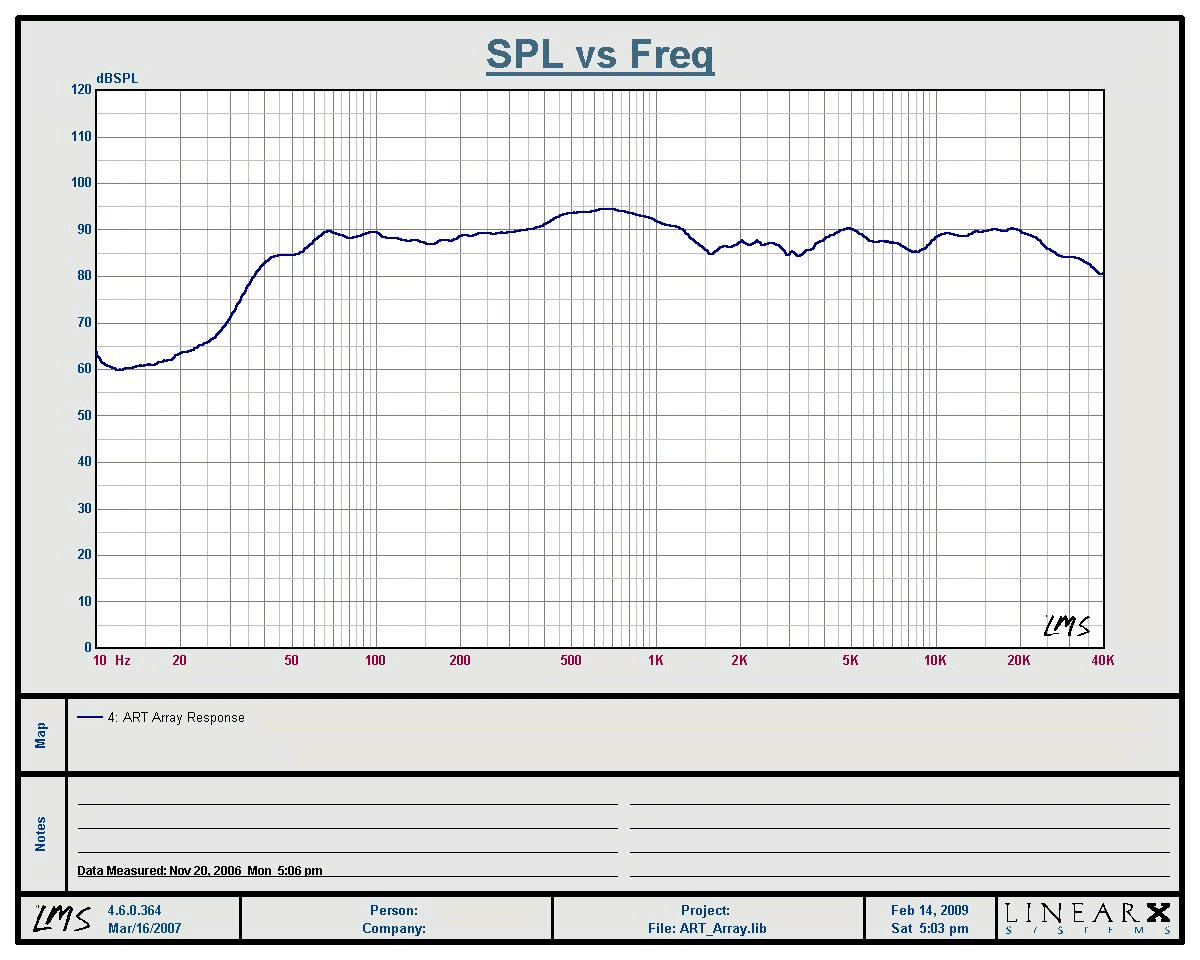
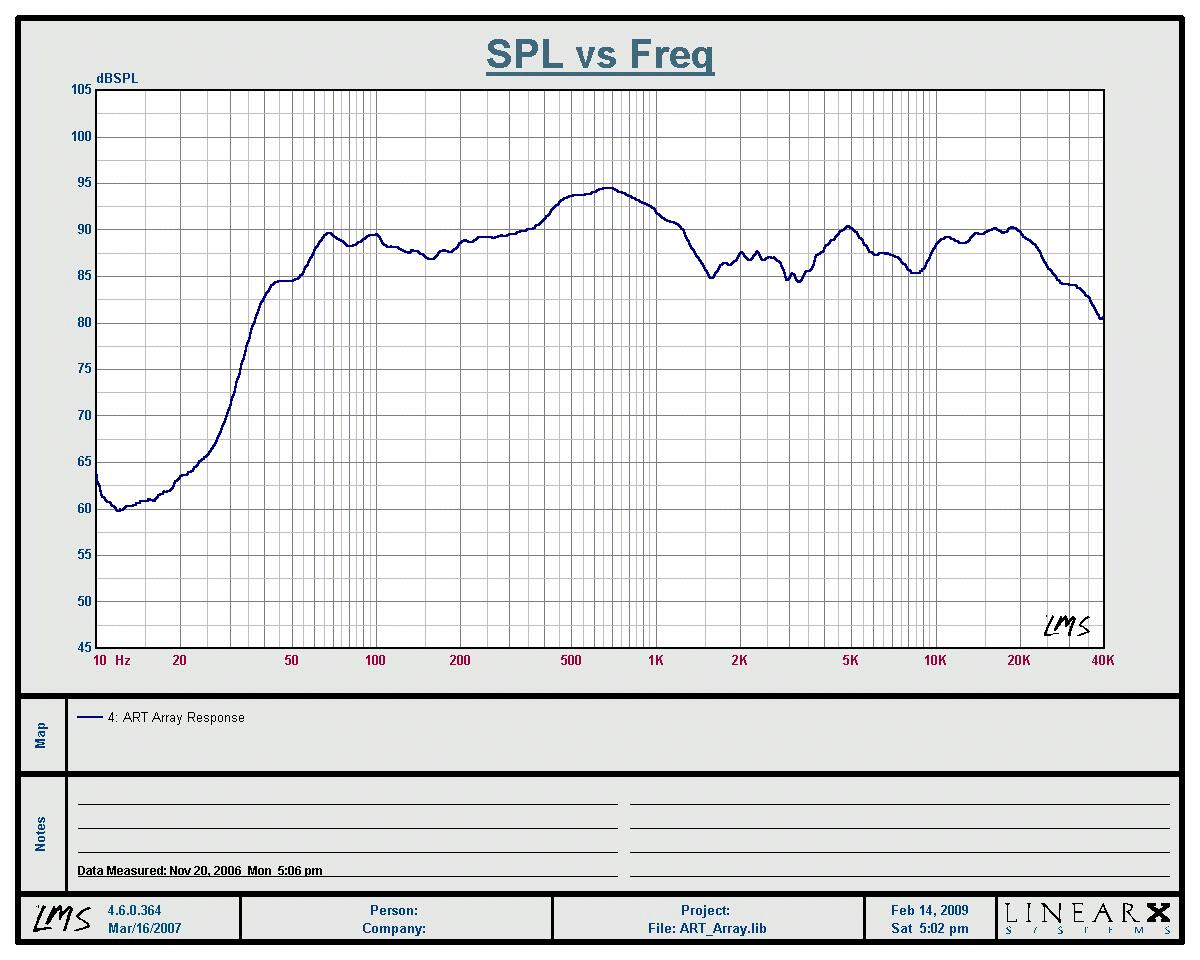
The original response chart posted for the ART Arrays was an unsmoothed chart, scaled to show detail very clearly. This kind of chart is very unflattering, and if people aren't used to seeing charts like this, they can easily misinterpret the data. It does look rough, but any speaker you measure at that high resolution will look somewhat rough. So I've dusted off the old datasets of the ART Arrays and reposted them in two other ways, one that is scaled 10dB/division and another that is 10dB/division and smoothed to 1/3rd octave resolution. This is the way most are accustomed to seeing the data, since most marketing materials and published response charts are done this way.

I said in the PE thread that the 1/3rd octave chart was within +/-3dB from 40Hz - 25kHz and that's not completely accurate. I was shooting from the hip when saying that. The actual figures are closer to 55Hz - 25kHz, +/-3dB. Still a very good response chart.
The unsmoothed response chart is shown below. When shown in higher resolution, some detail becomes clear that shows small valleys in the passband that dip below -3dB from the average level. The hump at 700Hz can be seen to rise above +3dB also. This is not unusual, many speakers have these kinds of features that show up in response in an unsmoothed chart.
One thing that is different between this chart and the original one posted a couple years ago is that it is scaled to 10dB per division rather than 5dB per division. Scaling makes a visible difference in that peaks and valleys don't seem so large.

I measured the ART Arrays a couple years ago, and looked at them in several ways. I did not publish all of the data I captured, not even close, but I did get a pretty good understanding of what they are capable of. One of the things I noticed was that they were fairly insensitive to placement, that changes in boundary conditions didn't change the response much. Another thing I noticed was as long as you were more than a few feet back, response was pretty uniform with the microphone within about 30° from being straightforward from the tweeter. I didn't get out the protractor to measure polars, but I did notice that the boom could be moved around quite a bit and still get fundamentally the same chart.
This was with the crossover having symmetrical slopes for woofer and tweeter. I also measured a crossover having different slopes for woofer and tweeter, and it did not sum properly in any plane. The woofer array and tweeter are all mounted on the same baffle, so this makes sense. In a way, the tweeter becomes a part of the array in the overlap band.
I would expect that crossovers with higher order filters on the tweeter might work OK at very close distances straight on axis with the tweeter. If the measurement microphone is very close to the loudspeaker and straight on axis with the tweeter, then it is further from the woofer array. The added delay from a higher-order HP filter on the tweeter would make summing right in this special case where the listener is abnormally close to the tweeter. However, at normal listening distances, the listener will be approximately the same distance from the tweeter as the woofer array, certainly to the inner woofers. That's why crossovers with symmetrical slope provide the best summing.
The original response curve I posted was unsmoothed and the plot is scaled to show a lot of detail.

It is possible that the 700Hz hump could be reduced with a notch filter or an overdamped LP filter on the woofers. However, the hump is immediately below the crossover frequency, which makes it difficult to use an overdamped LP filter without reducing the effective crossover frequency. An overdamped filter will make the woofers rolloff too soon.
A crossover can be easily developed with an overdamped low-pass circuit or lower crossover frequency. The problem is, that makes it necessary to lower the HP frequency for the tweeter too. If the slope of the tweeter is made higher, it will reduce stop-band energy, so a balance may be made between crossover frequency and slope. It might be possible to find a set of values that satisfies all these conditions, but it is a non-trivial problem because there are competing priorities.
In the final analysis, I think the simple first-order crossover is one of the better choices for this loudspeaker, if not the best choice. I would not have guessed that when I first looked at the speaker. I would have guessed a higher-order crossover would have been better. But the first-order crossover is simple, the measurements look good and it sounds good too.
[ GroupBuild Forum ] [ Help ]